What Is GTmetrix? The Ultimate Guide to Website Speed Analysis
TL;DR
- GTmetrix is a free online tool that tests and analyzes website speed and performance, helping you understand what’s slowing down your site.
- It provides key metrics like Performance Score, Structure Score, and Core Web Vitals (LCP, TBT, CLS) powered by Google Lighthouse to show how well your site loads and behaves for users.
- The tool offers detailed visual reports including waterfall charts and video playback so you can pinpoint slow-loading elements and layout shifts.
- Testing can be done from different global server locations, simulating various user experiences and network conditions.
- GTmetrix gives clear, actionable recommendations—such as optimizing images, enabling caching, or using a CDN—to improve your site’s speed and user experience.
- Improving GTmetrix scores can boost search engine rankings, reduce bounce rates, and increase conversions for your business or website.
If you’ve ever felt the frustration of a slow-loading website, you know that every second counts. In my ten years of optimizing websites, I’ve seen firsthand how speed can make or break a business. A fast site keeps users engaged and happy, while a slow one sends them clicking the back button without a second thought. That’s why understanding your site’s performance is non-negotiable, and tools like GTmetrix are indispensable.
GTmetrix is one of the most popular website speed testing tools out there, but its reports can look intimidating at first glance. Don’t worry—I’m here to demystify it for you. This guide will walk you through everything you need to know about GTmetrix, from what it is and how it works to interpreting your results and making tangible improvements. By the end, you’ll have the confidence to use the GTmetrix tool to analyze your site’s speed and turn those insights into a faster, more successful website.
What Is GTmetrix and Why Do Website Owners Use It?
At its core, GTmetrix is a free online tool that analyzes your website’s speed and performance. It gives you a detailed breakdown of how quickly your pages load and provides actionable recommendations to make them faster. It’s a favorite among developers, SEO specialists, and business owners for its comprehensive yet understandable approach.
Overview of GTmetrix as a Speed-Testing Tool
Think of GTmetrix as a health check for your website. You enter your URL, and it simulates a user visiting your page. It then measures how long it takes for different parts of your site to load and presents the findings in a detailed report. This GTmetrix performance report includes grades, scores, and specific metrics that pinpoint exactly where your site is performing well and where it needs work.
Why Speed Matters for SEO, UX, and Conversions
Why all this fuss about speed? Because it directly impacts your bottom line.
- SEO (Search Engine Optimization): Google has used site speed as a ranking signal for years. With the introduction of Core Web Vitals, it’s more important than ever. Faster websites provide a better user experience, which search engines reward with higher rankings.
- UX (User Experience): No one likes to wait. A slow site frustrates visitors, leading to high bounce rates. A fast, responsive site, on the other hand, creates a smooth and enjoyable experience, encouraging users to stay longer and explore more of your content.
- Conversions: The link between speed and conversions is undeniable. Even a one-second delay in page load time can lead to a significant drop in conversions. For an e-commerce site, that means lost sales. For a lead generation site, it means fewer sign-ups.
What Metrics Does GTmetrix Measure?

A GTmetrix report is packed with data. Let’s break down the most important metrics explained in every analysis.
Performance Score
This is your main headline score, shown as a percentage. It’s powered by Google Lighthouse and reflects your site’s loading performance and interactivity from a user’s perspective. It’s a weighted average of several individual metrics, including the Core Web Vitals.
Structure Score
The Structure Score evaluates how well your website is built for optimal performance. It checks for things like proper image optimization, efficient CSS and JavaScript delivery, and more. While Performance tells you how fast your site is, Structure tells you why it is or isn’t fast by assessing its technical setup.
Web Vitals (LCP, TBT, CLS)
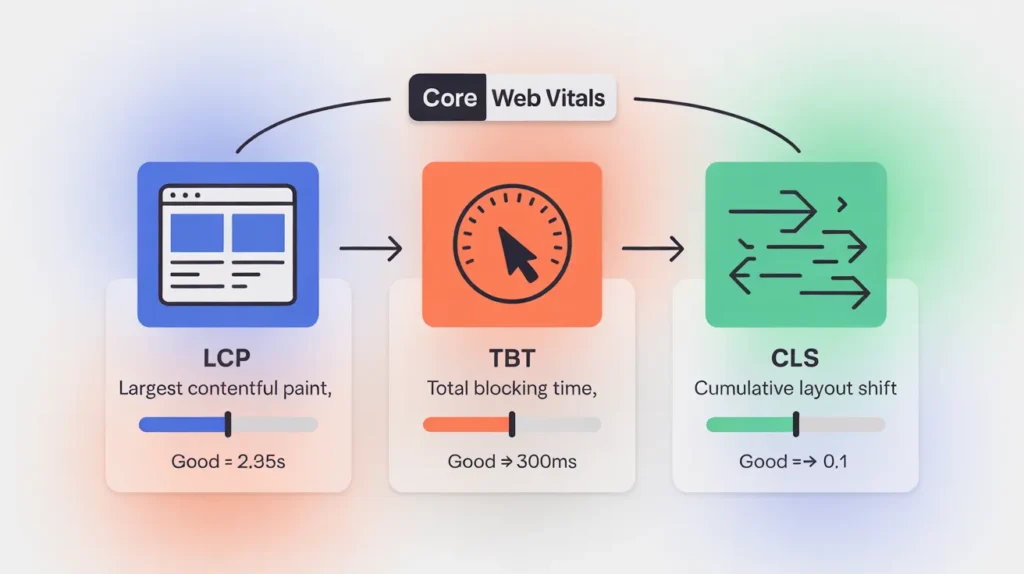
Core Web Vitals are a set of specific factors that Google considers important for a webpage’s overall user experience.
- Largest Contentful Paint (LCP): Measures how long it takes for the largest image or text block to become visible. A good LCP is under 2.5 seconds.
- Total Blocking Time (TBT): Measures the total time your page was blocked from responding to user input (like a click or tap) during loading. A good TBT is under 300 milliseconds.
- Cumulative Layout Shift (CLS): Measures the visual stability of your page. It quantifies how much unexpected layout shifts occur as the page loads. A good CLS score is below 0.1.
Page Load Timeline
The GTmetrix speed test also provides a visual timeline of the loading process. This includes key milestones like Time to First Byte (TTFB), First Contentful Paint (FCP), and when the page becomes fully loaded. This timeline helps you visualize bottlenecks in the loading sequence.
How Does GTmetrix Work Behind the Scenes?
To trust the data, it helps to understand how GTmetrix gathers it.
Lighthouse Engine Integration
GTmetrix uses Google Lighthouse as its performance monitoring engine. This is a huge advantage because it means the metrics you see in GTmetrix are the same ones Google uses to evaluate your site for its search rankings. This alignment makes your optimization efforts more effective for SEO.
How Test Locations and Browsers Affect Results
Your website’s speed can vary depending on where your visitor is located. GTmetrix allows you to run tests from various global locations. If your audience is in the US, testing from a server in Dallas will give you more accurate results than testing from London. The tool also uses a real browser (Google Chrome) to load your site, providing a realistic simulation of a user’s experience.
How GTmetrix Analyzes Page Rendering
GTmetrix doesn’t just time your page load; it records a video of it. This lets you see exactly what your visitors see as the page renders, frame by frame. You can spot layout shifts, identify which elements appear first, and diagnose visual loading issues that metrics alone might miss.
How Do You Run a GTmetrix Speed Test?
Getting started is simple. Here’s a quick walkthrough.
Step-by-Step Overview
- Navigate to the GTmetrix website.
- Enter your website’s URL into the analysis field.
- Click “Test your site.”
After a minute or two, your comprehensive GTmetrix performance report will be ready.
Choosing Test Locations, Browsers, and Connection Speeds
For more accurate testing, you can sign up for a free account. This unlocks options to select the test location, browser, and connection speed. Always choose a location closest to your target audience. You can also simulate different network conditions, like a slow 3G connection, to understand how your site performs for users with slower internet.
Understanding the GTmetrix Dashboard
The dashboard presents the most critical information at a glance: your Performance and Structure scores, Core Web Vitals, and top performance issues. It’s your command center for identifying what to fix first.
How Do You Read a GTmetrix Report Correctly?
The report is divided into several tabs. Let’s explore what each one offers.
Summary Tab
This is your high-level overview. It displays your GTmetrix grades, scores, and Core Web Vitals. It also shows a speed visualization of your page load and lists the top optimization opportunities. Start here to get a quick sense of your site’s health.
Performance Tab
This tab dives deep into the Lighthouse performance metrics. You’ll find a detailed breakdown of your Performance Score, with individual metrics like FCP, LCP, and TBT. It shows you exactly how each metric contributes to your overall score, helping you prioritize your efforts.
Structure Tab
Here, you’ll find a checklist of best practices. GTmetrix audits your site against these practices and flags any issues. Each recommendation comes with an explanation and often points to the exact files or resources that need attention. Fixing these items will directly improve your Structure Score.
Waterfall Chart
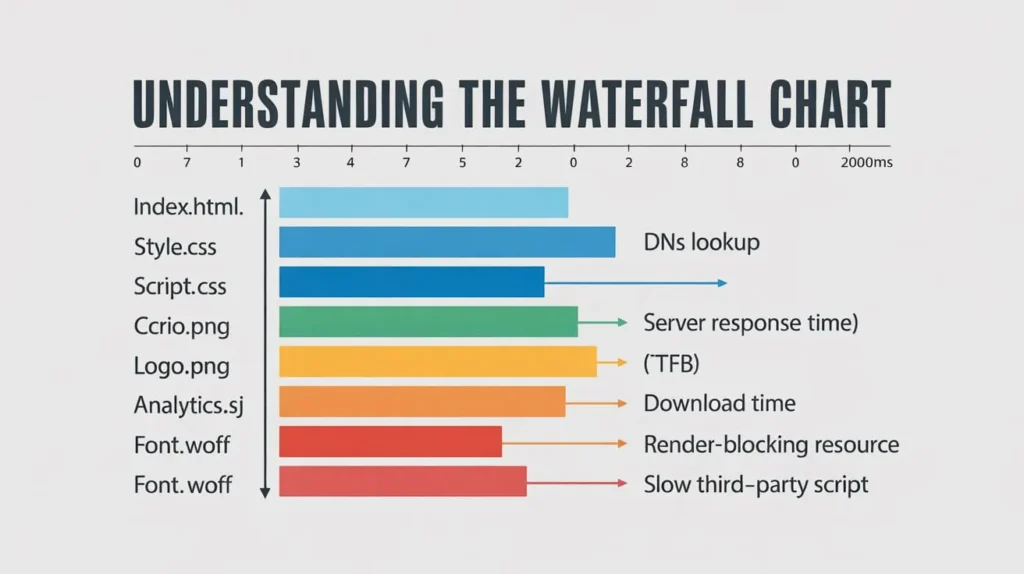
The GTmetrix waterfall chart is one of its most powerful features. It’s a visual representation of every single request made by your browser to load your page. Each bar represents a resource (like an image, CSS file, or script), showing how long it took to download. This is where you can pinpoint exact bottlenecks.
Video and History Tabs
The Video tab provides a filmstrip view and a video playback of your page loading process, which is incredibly useful for spotting layout shifts (CLS). The History tab tracks your performance over time, allowing you to monitor the impact of your optimizations through graphs of your scores and page load times.
What Do the GTmetrix Grades Mean?
GTmetrix uses a simple A to F grading system to help you quickly assess performance.
A to F Grades Explained
- A: Excellent (90%+)
- B: Good (80-89%)
- C: Average (70-79%)
- D: Below Average (60-69%)
- F: Poor (Below 60%)
These grades apply to both the Performance and Structure scores, giving you an immediate sense of where you stand.
What Influences Your Score?
Your scores are influenced by a combination of on-page factors (like image sizes and code efficiency) and server-side factors (like your hosting environment). A low grade in Structure often points to on-page issues you can fix, while a low Performance score can be affected by both on-page elements and slow server response times.
Realistic Expectations for Shared, VPS, and Dedicated Hosting
Your hosting plan plays a massive role in your site’s speed.
- Shared Hosting: Affordable but often slower, as you share server resources with many other websites. Achieving an ‘A’ can be challenging.
- VPS (Virtual Private Server): A significant step up. You get dedicated resources, leading to faster and more consistent performance. ‘A’ grades are very attainable.
- Dedicated Hosting: The top tier, offering the best possible performance. It provides an entire server just for your site.
How Does GTmetrix Compare to Google PageSpeed Insights and Pingdom?
GTmetrix is one of several popular website speed testing tools. Here’s how it stacks up against the competition.
Key Differences in Scoring
- GTmetrix vs. PageSpeed Insights (PSI): Both use Lighthouse, so their core performance scores are similar. However, GTmetrix provides a separate “Structure” score and a more detailed waterfall chart, offering deeper diagnostic capabilities. PSI focuses heavily on Core Web Vitals and provides both lab (simulated) and field (real-user) data.
- GTmetrix vs. Pingdom: Pingdom is simpler and provides a very clean, easy-to-read report. It’s great for a quick check-up. GTmetrix, with its Lighthouse integration and detailed structure analysis, offers more actionable, SEO-focused advice.
When to Use Each Tool
- Use GTmetrix for in-depth analysis, detailed recommendations, and waterfall chart troubleshooting.
- Use PageSpeed Insights to see how Google views your site and to access real-user data (field data) if your site has enough traffic.
- Use Pingdom for quick, easy-to-understand performance snapshots and uptime monitoring.
Why Many Professionals Combine All Three
I personally use all three. I start with GTmetrix for a detailed technical audit. Then, I cross-reference with PageSpeed Insights to confirm the Core Web Vitals metrics and see Google’s perspective. I use Pingdom for ongoing monitoring. Combining them gives you a complete, well-rounded view of your site’s performance.
How Can You Improve GTmetrix Scores Effectively?
Once you have your report, it’s time to take action. Here are some common GTmetrix recommendations.
Optimize Images and Media
Large, unoptimized images are one of the most common causes of slow websites. Use tools to compress images without losing quality and serve them in modern formats like WebP.
Enable Caching and Compression
Browser caching stores parts of your website on a visitor’s device, so they don’t have to be re-downloaded on subsequent visits. Gzip compression reduces the size of your files (HTML, CSS, JavaScript), making them faster to download.
Reduce JavaScript and CSS Blocking
Render-blocking resources prevent your page from displaying until they are downloaded and processed. Defer the loading of non-critical JavaScript and CSS files so that the main content of your page can appear faster.
Improve Server Response Time (Hosting Impact)
Your Time to First Byte (TTFB) is heavily dependent on your hosting provider. If your TTFB is high, no amount of on-page optimization will fully solve your speed problems. This is where quality hosting becomes critical.
How Does Hosting Affect GTmetrix Performance?
Your hosting is the foundation of your website. A shaky foundation means a shaky (and slow) website.
Impact of Server Speed on Core Web Vitals
A slow server directly impacts LCP and TBT. If your server takes a long time to send the first byte of data (high TTFB), your entire page rendering process is delayed, pushing back your LCP. Overloaded servers can also struggle to execute scripts quickly, increasing your TBT.
Why Many Businesses Upgrade to VPS for Better Scores
When I work with clients on shared hosting who are struggling to break past a ‘C’ or ‘B’ grade, upgrading their hosting is often the first thing I recommend. Moving to a quality VPS can instantly improve TTFB and provide the resources needed for the site to perform under pressure. The difference is often night and day.
How skynethosting.net Improves GTmetrix Results
Choosing the right host makes all the difference. For example, a provider like skynethosting.net is built for speed. They use cutting-edge technology like NVMe VPS storage, which is significantly faster than traditional SSDs. They also leverage LiteSpeed Web Server, known for its superior performance over standard Apache servers, especially for WordPress sites using the LiteSpeed Cache plugin. With global datacenters, you can host your site close to your audience, further reducing latency. These features directly address the core factors that lead to better GTmetrix scores.
How Do You Use the GTmetrix Waterfall Chart for Troubleshooting?

The waterfall chart is your best friend for diagnosing complex issues.
Identifying Slow Requests
Look for long bars in the chart. These represent files that are taking a long time to download. This could be a massive image, a bloated script, or a slow API call.
Detecting DNS, TTFB, and Render-Blocking Issues
The first few bars in the waterfall show the initial connection process. You can see how long DNS lookup, the initial connection, and waiting for the server (TTFB) take. Long bars here point to server-side or network issues. You can also spot render-blocking resources by seeing which CSS and JavaScript files are downloaded before the page starts to render.
Finding Heavy Third-Party Scripts
Third-party scripts (like analytics, ad trackers, or social media widgets) can significantly slow down your site. The waterfall chart clearly shows requests to external domains. If you see long load times for these scripts, consider whether they are truly necessary or if a more lightweight alternative exists.
What Are Common GTmetrix Recommendations and How to Fix Them?
Here are a few more common suggestions and how to tackle them.
Reduce Unused JavaScript
Your theme or plugins might be loading JavaScript that isn’t needed on a particular page. Use a plugin like Perfmatters or Asset CleanUp to conditionally disable scripts where they aren’t required.
Serve Images in Next-Gen Formats
Formats like WebP offer better compression than JPEG and PNG. Most modern image optimization plugins (like Smush or ShortPixel) can automatically convert your images to WebP and serve them to compatible browsers.
Implement Efficient Cache Policy
This recommendation means you should leverage browser caching. If you’re using a caching plugin like W3 Total Cache or WP Rocket, ensure that the settings for browser caching are enabled and configured with a long expiration time for static assets.
Use CDN to Reduce Latency
A Content Delivery Network (CDN) stores copies of your website’s static files on servers around the world. When a user visits your site, the files are served from the closest server, dramatically reducing latency and speeding up load times.
Your Path to a Faster Website
Understanding GTmetrix is the first step toward building a faster, more effective website. It’s not just about chasing an ‘A’ grade; it’s about creating a better experience for your users, which in turn leads to better SEO, higher engagement, and more conversions.
Understanding GTmetrix for Better Website Performance
By now, you should feel comfortable running a GTmetrix speed test, navigating the report, and understanding what the key metrics mean. Use this knowledge to systematically identify and fix performance bottlenecks on your site. Don’t feel overwhelmed—tackle one recommendation at a time and use the History tab to track your progress.
Why Good Hosting + Optimization Delivers the Best Results
Remember, website performance is a partnership between on-page optimization and your hosting environment. You can have the most optimized site in the world, but it will still be slow on a poor-quality server. Conversely, great hosting can’t fully compensate for a poorly built site.
The best results come from combining smart, targeted optimizations with a powerful hosting foundation that can deliver your content to users quickly and reliably. Providers like skyenthosting.net offer NVMe hosting with LiteSpeed servers, which are specifically designed for high performance and can give your optimized site the speed it needs to excel.


